User driven data visualization
Qunb 2015
At Qunb, we’re building a tool that turns Google Analytics into “datastories”. I knew little about data visualization before joining, and when I went looking for good practices, I mostly found rules like “continuous values should be displayed as a line chart, discrete values as a bar chart”. Reasonable rules — but focusing on them misses the core of data visualization: communicating an idea.
We design data visualizations based on the type of data we want to show, not the message we want to communicate. As a result, most of them are poorly designed and hard to digest. They don’t address a clear use case — they just follow existing patterns, because it’s easy to pour new data into an old Excel template, or because the chart is generated automatically and nobody ever thinks about the message. If we used a line chart for last year’s sales, why change anything this year? Even if the message is completely different?
These visualizations are data driven. I’ll try to explain why that’s a bad approach, and how to switch to user driven representations.
But first, what is a data visualization?
Here is a simple dataset:
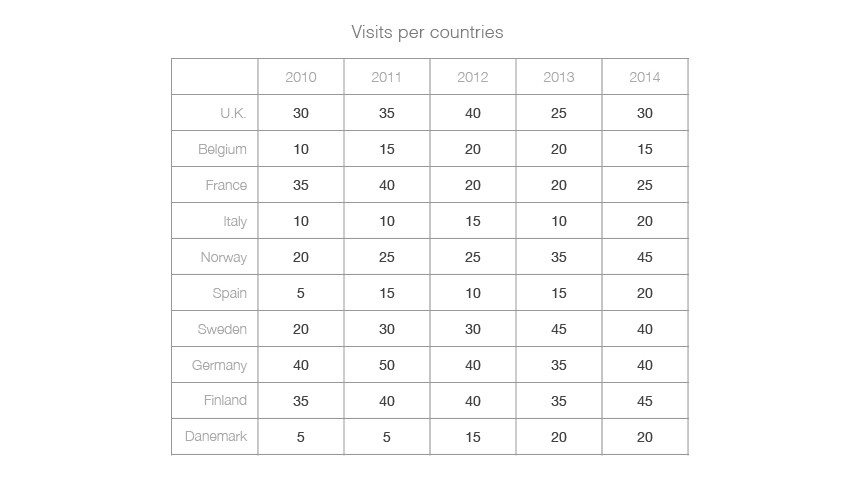
It’s expressed as numerical values in a table. Numbers are a great way to communicate quantities, and a table is a good way to structure information — in some ways, this is already a very simple data visualization.
But there is more in this dataset than structures and quantities. There are things we can’t see here (or can barely see), things that lie between the numbers and the lines: relationships and patterns.
A data visualization is a lens put on top of these patterns and relationships.
We can already identify some patterns in the table, why would we need more?
Our visual hardware is powerful: we can “feel” a lot of visual information. But our cognitive bandwidth is limited, and we can’t actually process all of it. Selecting which information deserves attention is tricky, and the user is often left alone at that step.
We can discover patterns just by reading the numbers in the cells, but it takes some mental gymnastics: “this number is greater than this one, and the evolution of this one seems linked to that one — but that’s not true for this dimension”.
Numbers let us represent a complex abstraction: quantities. We need another tool for an even more complex abstraction: the relationships between quantities. That’s what data visualizations are for.
How to extract knowledge from data
There are two ways:
- Data exploration: the user pulls the knowledge from the visualization.
- Data explanation: the visualization pushes the knowledge to the user.
Both are viable. It’s a matter of identifying which one is your first use case — and things aren’t black or white, most of the time you’ll need a bit of both.
Most data visualizations sit on the exploration side, not because it was identified as the use case, but because that’s where a data driven approach naturally lands: throw a bunch of data into the most common template and let the user handle it. Data explanation is almost always ignored.
Let’s come back to our example:
This table is a (quite extreme) example of data exploration: the user can pull some knowledge out of it. But what if we want to communicate one specific dimension of the dataset?
Say we want to send a client a report about visits per country. The common approach is to pick the visualization based on the type of the data. We’re dealing with locations, so we’ll use a map:
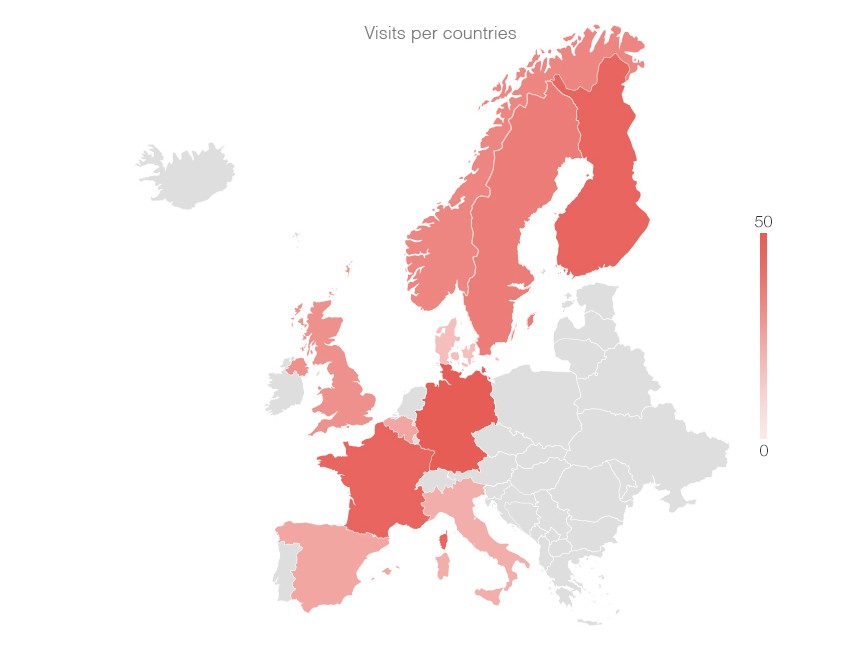
Think of visits per country in Google Analytics, or any location based dataset: no matter what’s actually interesting in it, you’ll usually end up with a map.
But what kind of information does a map convey? A visualization helps us see patterns — location patterns, in this case — and a map is bad at everything else. If we wanted to show a location pattern, like visits getting more frequent as we approach Scandinavia, a map would be great:
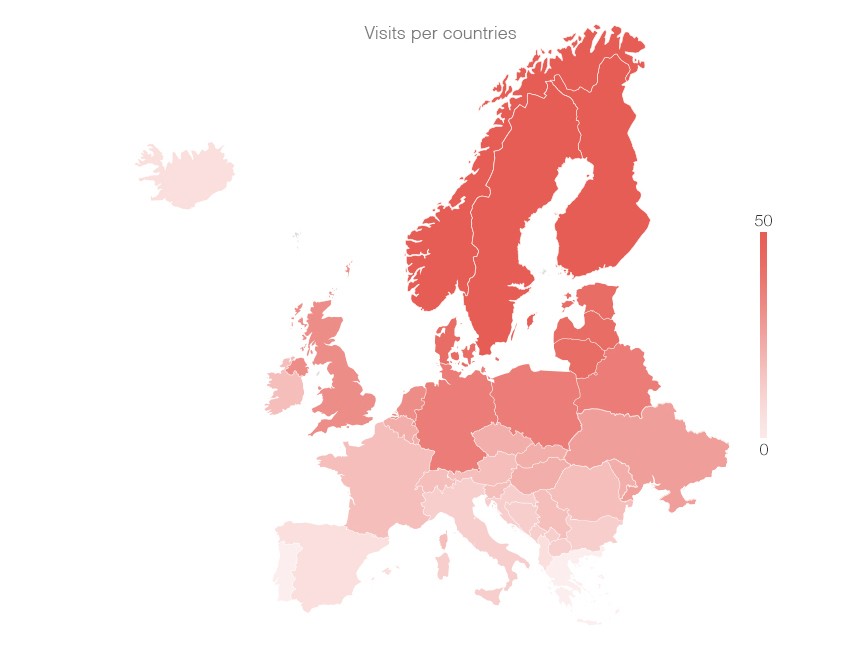
Let’s be honest though: that kind of pattern doesn’t emerge very often. Yet we reach for a map every time the data is location based, whatever the message. The data type drives the representation. This is a data driven approach.
Looking at the same dataset, we can notice a few interesting things — for instance, Germany seems to have performed very well compared to other countries in 2011. That’s not easy to see in the table:
And not really better on the map:
A map is just not a good representation for ranking values. If the message is that Germany outperformed every other country in 2011, why not use a representation made for comparing values? Like a simple bar chart:
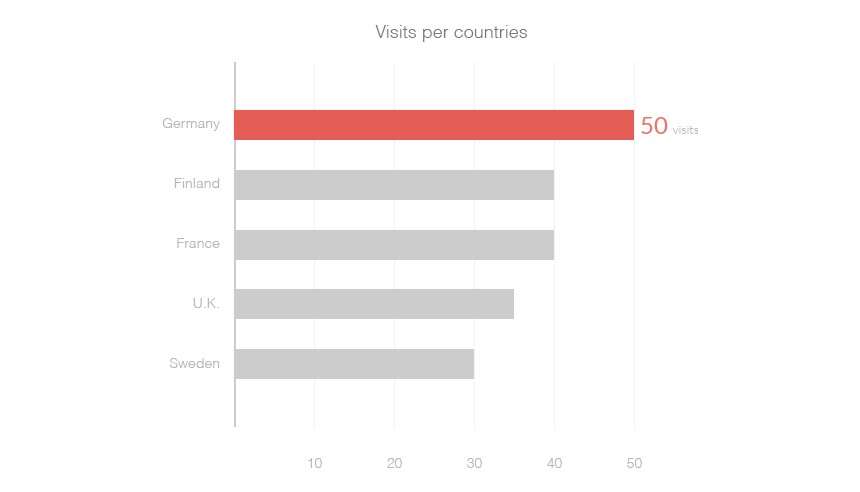
Here, the message drives the representation. This is a user driven approach.
That doesn’t help to pick the proper visualization though
There are tons of ways to represent quantitative information and people are really creative…
But a few common representations are always useful, and to choose between them, it helps to define the type of message we’re trying to communicate.
Think of the questions you ask yourself in front of a dataset: is this number greater than that one? Is this linked to that? These questions are your users’ needs — and they’re all about comparison. Comparison is the primitive user need of data visualization. We always compare values, or series of values, in order to:
- Establish a ranking: How high is “this” compared to “that”?
- Show an evolution: How does “this” move over time?
- Determine a causality: What impact does “this” have over “that”?
- Highlight a correlation: Is “this” linked to “that” without any obvious reason?
- Observe a deviation: Does “this” diverge from the reference?
- Explain a composition: How is “this” made up of “these”?
- Illustrate a distribution: How are “these” spread on “that”?
Here again, things aren’t black or white: we’ll often communicate several types of messages in the same visualization, which usually calls for a more complex representation — a composition of several charts, for instance.
Some rules of thumb help pick the right chart. For example, some charts use areas to convey two variables through one shape: height for one, width for the other:
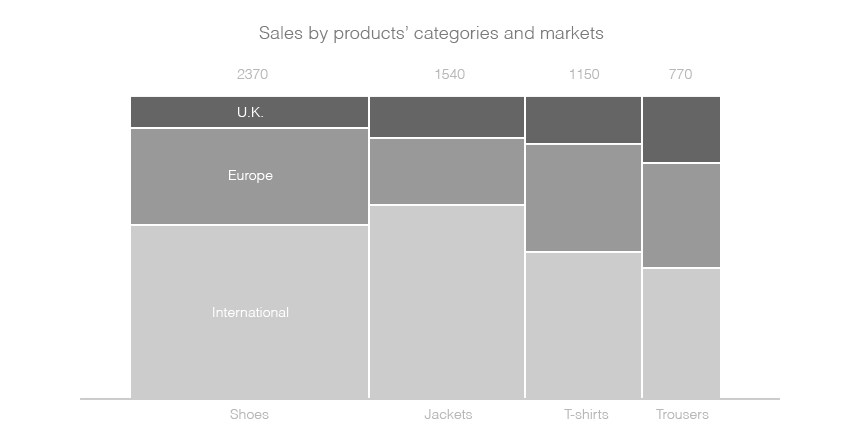
This is incredibly hard to read, because comparing areas is almost impossible. But areas can be useful to illustrate the composition of an element:
Each part is harder to compare, but the abstraction of the whole — and how the parts relate — is easier to grasp.
This example points to the two properties of a good representation:
- It’s easy to compare (values, series,…).
- It’s easy to understand the abstraction (composition is an abstraction of the whole, evolution an abstraction of change, etc).
And how does a visual representation actually convey information?
Stephen Few wrote a very interesting paper about rules for encoding values in graphs. He describes the basic visual components used to encode information: points, lines, and bars.
These three are the most common elements, but if we take another step back, four visual properties can convey information in any kind of representation:
- The shape
- The colour
- The dimension
- The position
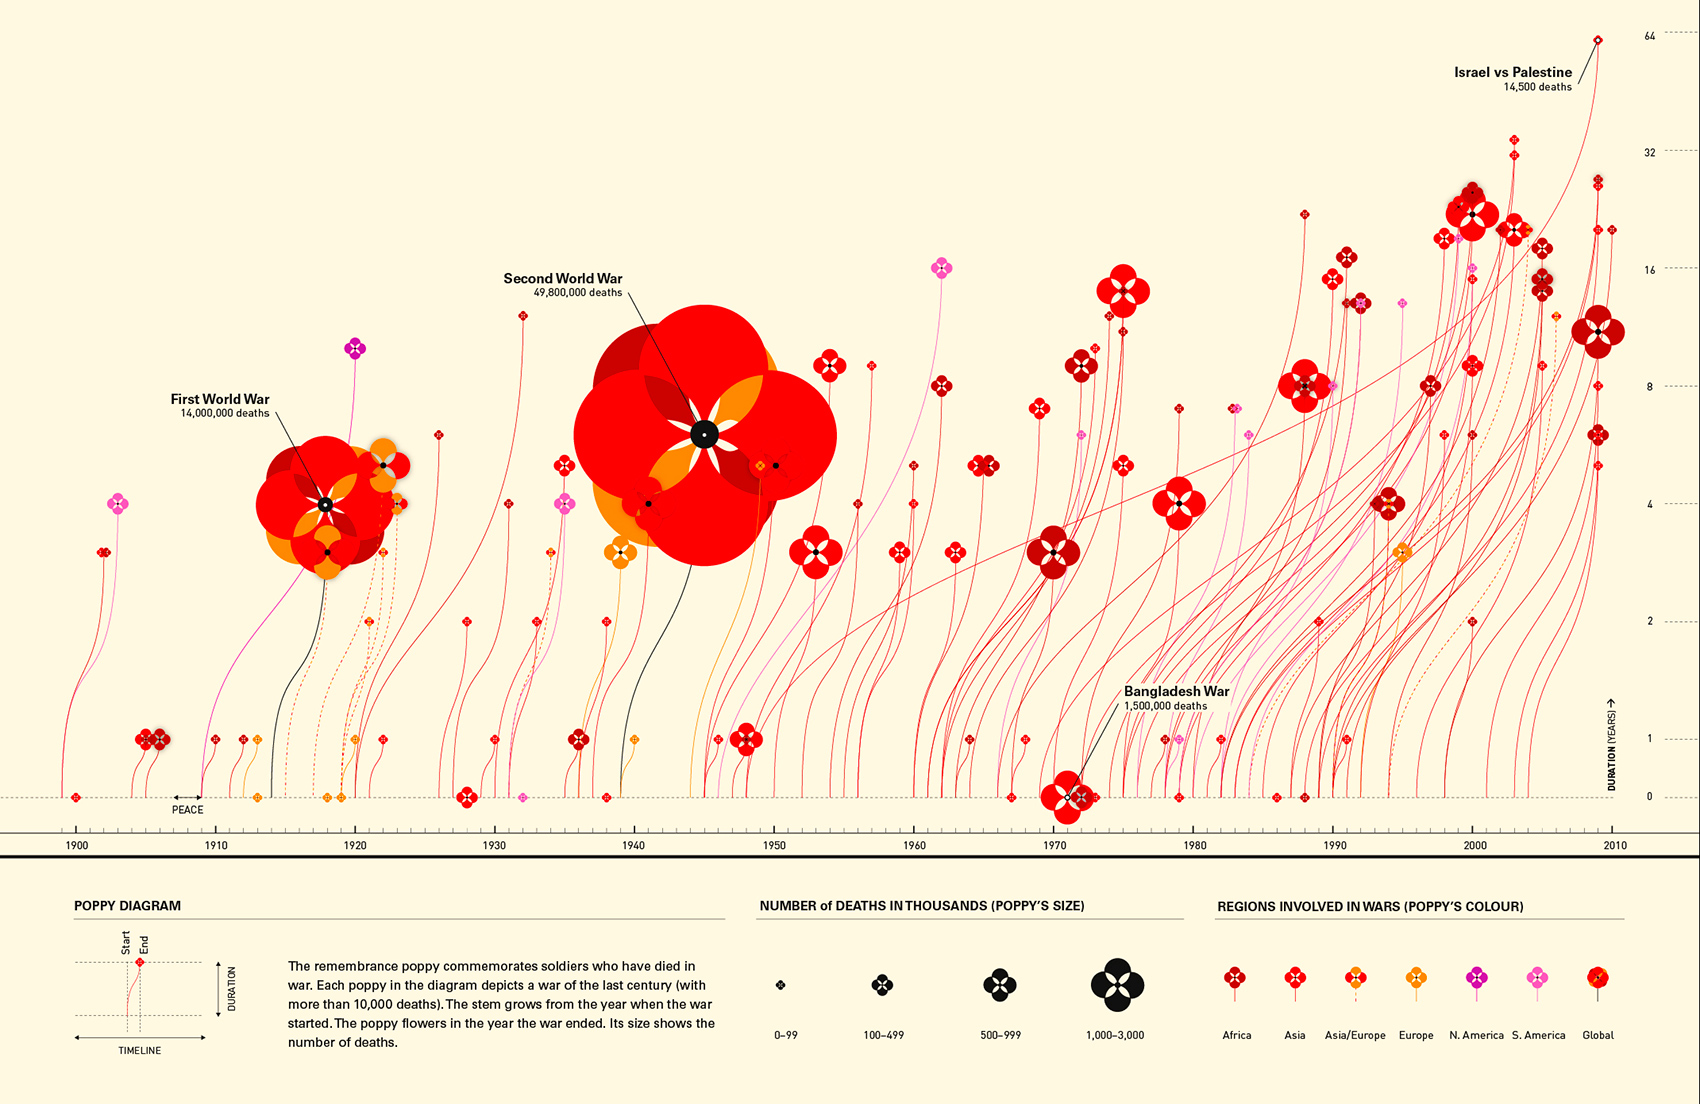
Look at this example:
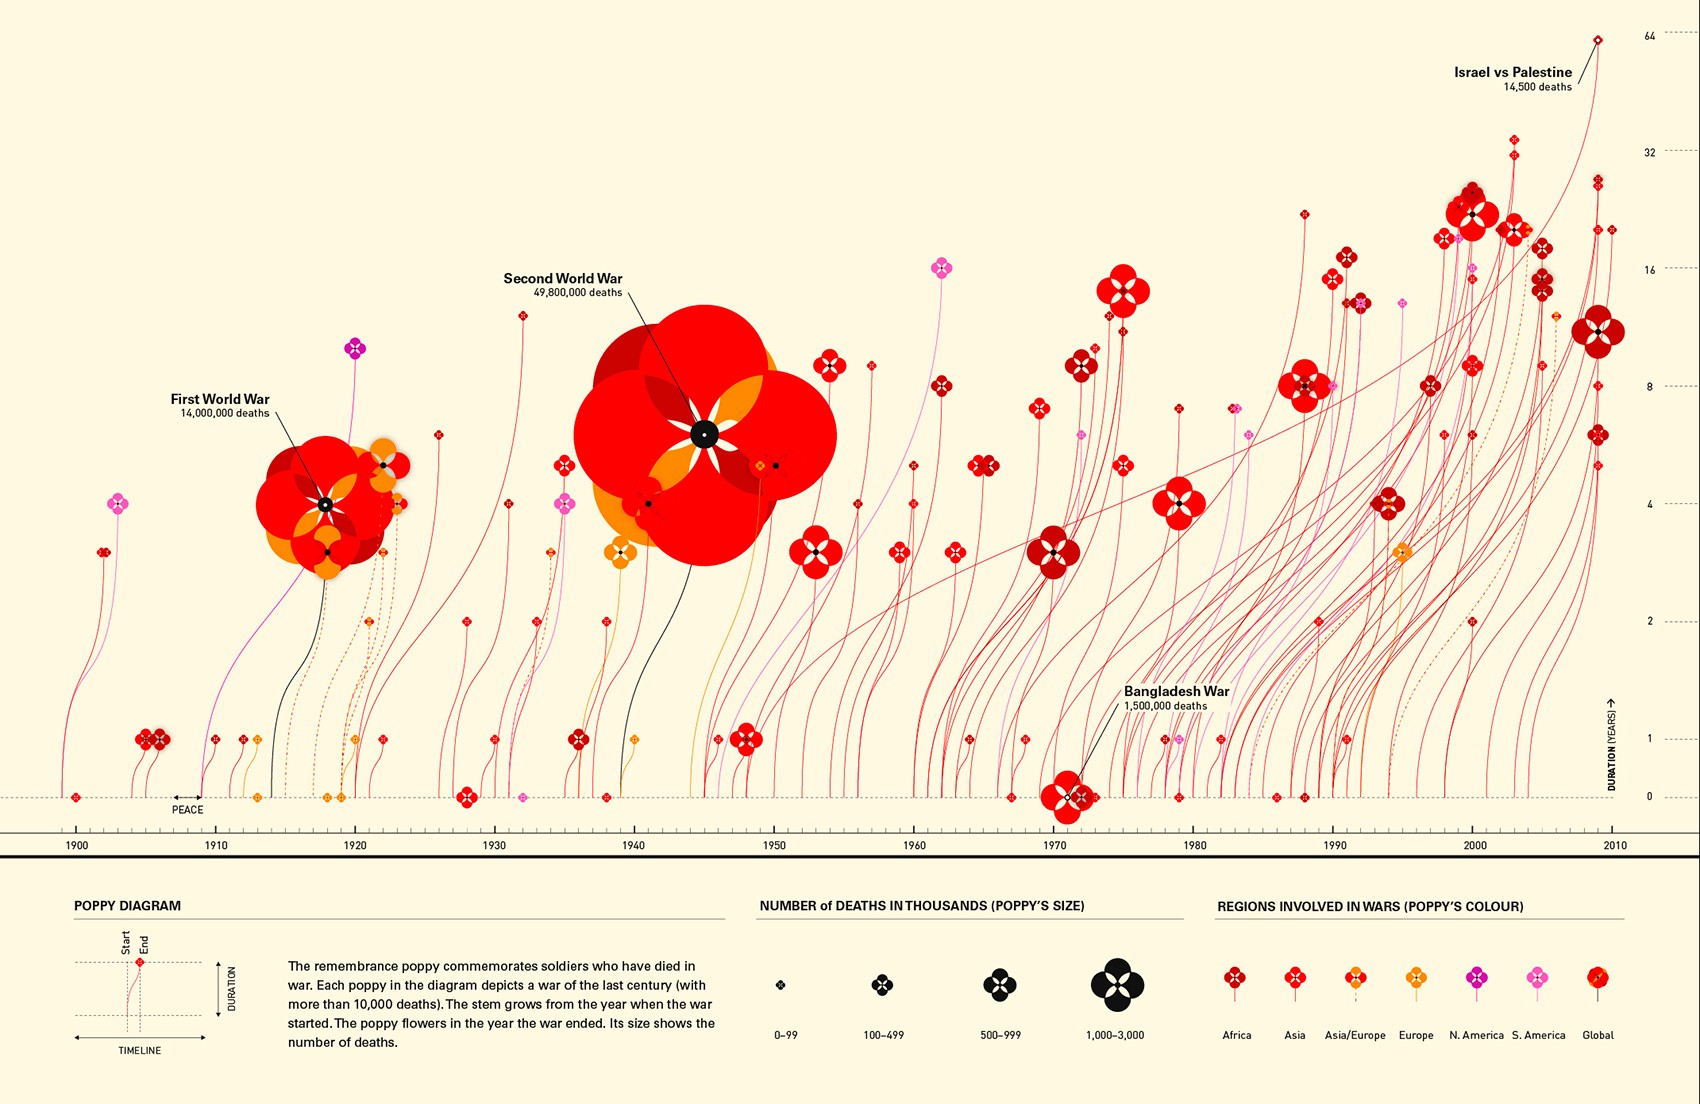
Chart by Valentina D’Efilippo
This chart leverages all four. Shape represents an abstract concept — deaths in wars — with flowers. Colour creates categories, the regions. The dimension of each flower illustrates the number of deaths. And the position of the flowers and lines represents time.
We know how to map a message to a representation, but how to identify interesting messages in the first place?
Finding interesting insights in a dataset can be challenging — the most famous illustration of the problem is Anscombe’s Quartet.
As Bret Victor puts it in Up and Down the Ladder of Abstraction: “to understand a system, we must explore it” — and we explore complex systems by constantly moving between the levels of abstraction we use to represent them.
Every representation of a dataset stands at a specific level of abstraction: numbers are abstractions of quantities, mean and variance are abstractions of a series of numbers, a line chart is an abstraction of its evolution, a bar chart of its ranking, etc. Quickly running the data through these different representations is a good way to reveal interesting patterns. That’s how you realise that a dataset like Anscombe’s is more complex than it first looks.
So, the rest of the work is just about visual design, right?
Visual design is not the only way to convey information — use every tool your medium offers.
Animation, for instance, can be an amazing one. Take this poor visualization:
This chart is really hard to understand
Beyond the difficulty of comparing areas, it packs a lot of dimensions whose relationships aren’t clear. Watch what a very simple animation can do:
Animations can convey a lot of information
By animating the order in which elements appear — main categories from left to right, then sub-categories inside each one from bottom to top — we help the user understand how they relate.
Copywriting matters too. The words you choose, the symbols you use for your units, the way you truncate labels or round up values, the title, the values you decide to display — all of these decisions shape how the user perceives your message.
So do interactions, particularly for data exploration: allowing direct manipulation of the dataset engages users and pushes them to discover more.
And think about the user’s flow. You don’t have to tell everything in one representation: complicated problems can be broken down into smaller parts, spread in space (several representations on one page) or in time (a series of representations, one after the other).
Whatever you decide, make it intentional and meaningful.
That should always be your first concern when designing something: getting clear on what you’re trying to achieve. We moved web design from data driven to user driven fifteen years ago — remember email clients that simply mirrored the structure of a database? What a journey to something like Google Inbox! Data visualization needs to make the same move.
The type of data should only ever be a constraint. The use case — and thus the user — should always be the driver.